Book Bank
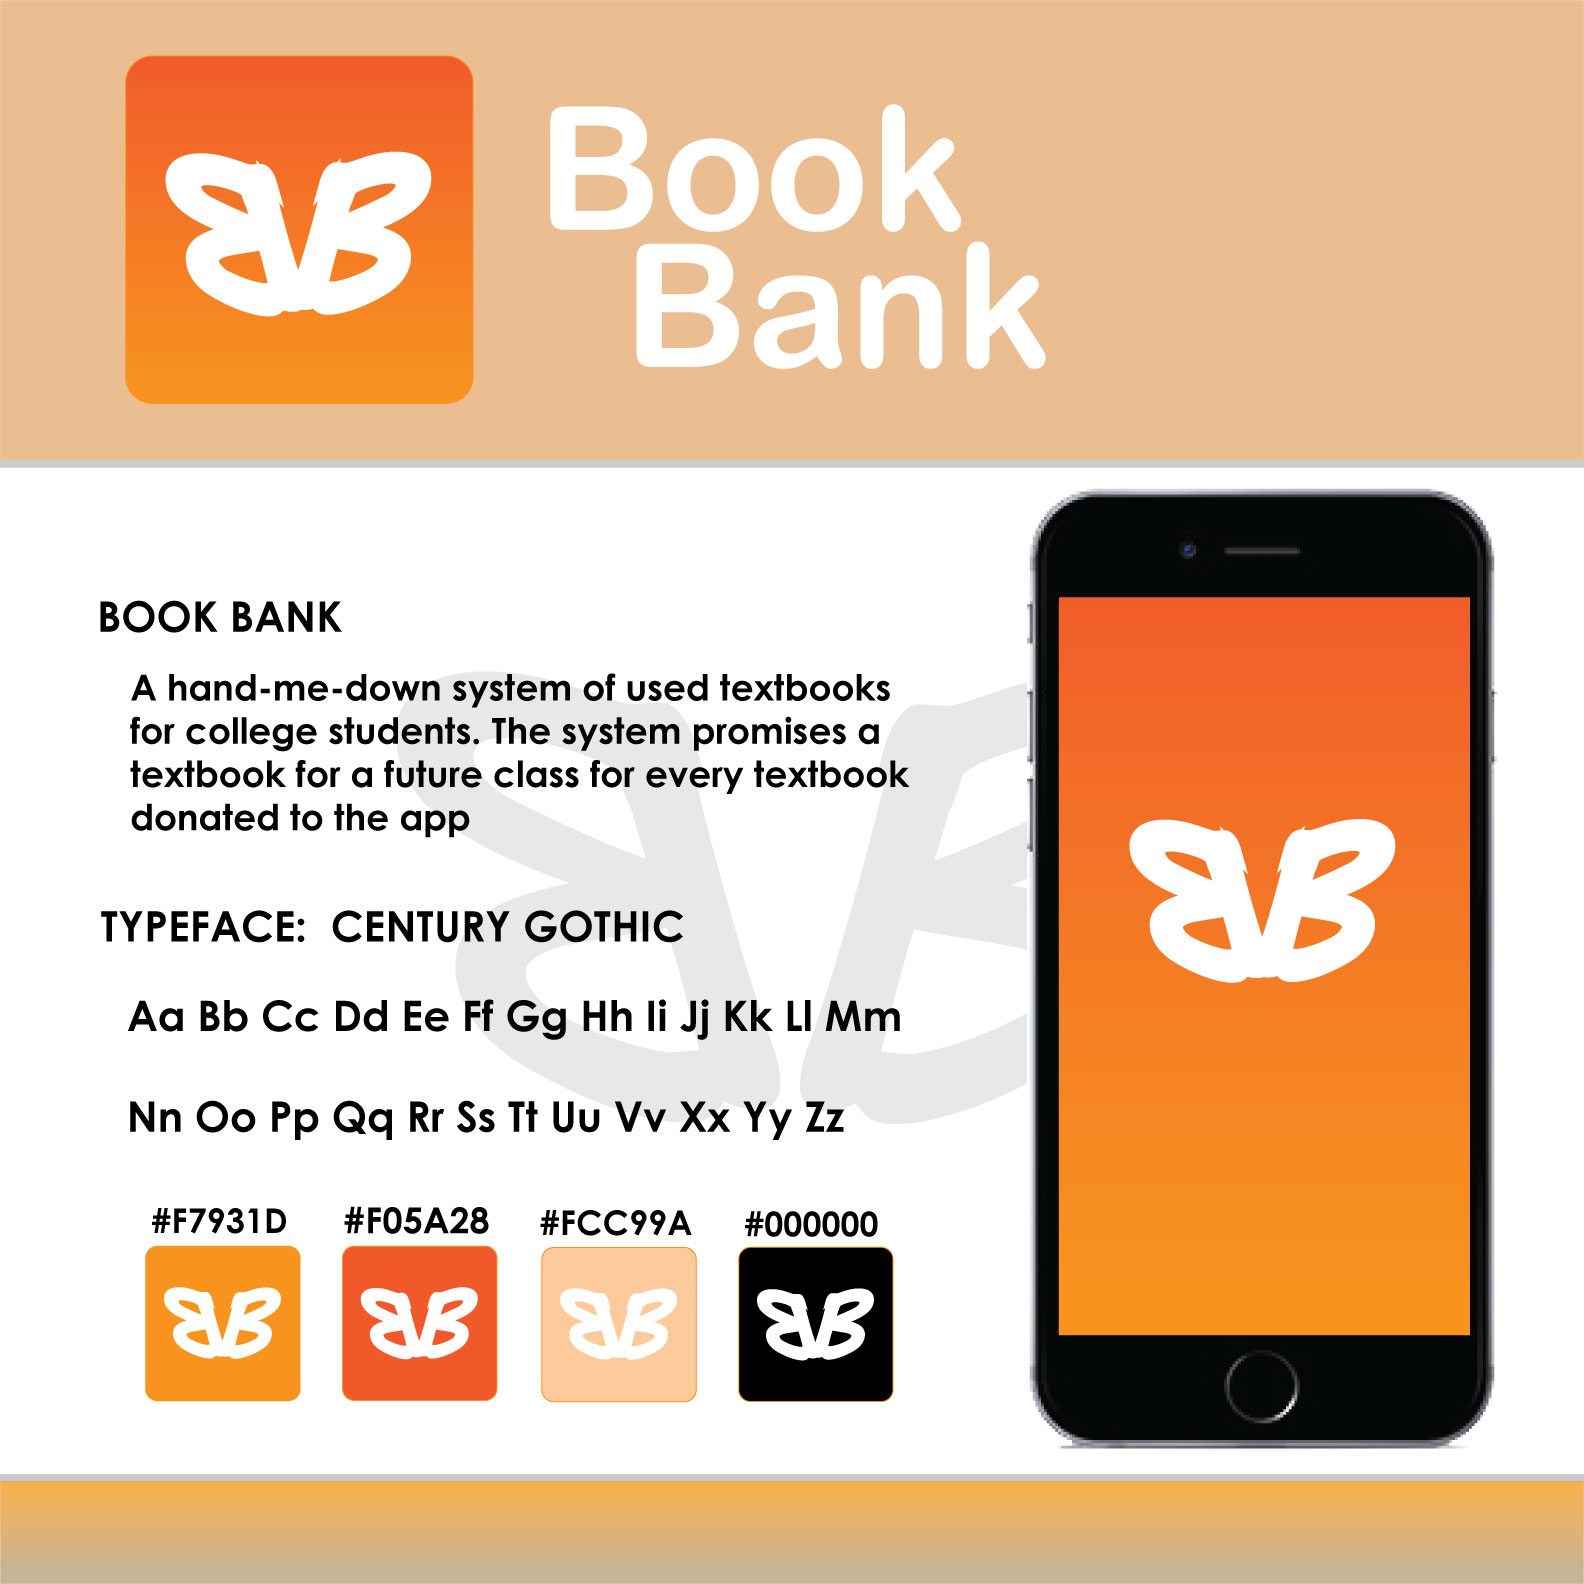
For this project I used Adobe Muse to create a phone app that would make acquiring new textbooks easier for students attending college. The app follows a hand-me-down like system of textbook borrowing. Every time you hand a textbook down to another student you will receive another textbook you need for an upcoming class you are taking. Thus cutting down on costs and wasted textbooks that just end up taking up space in your desk.
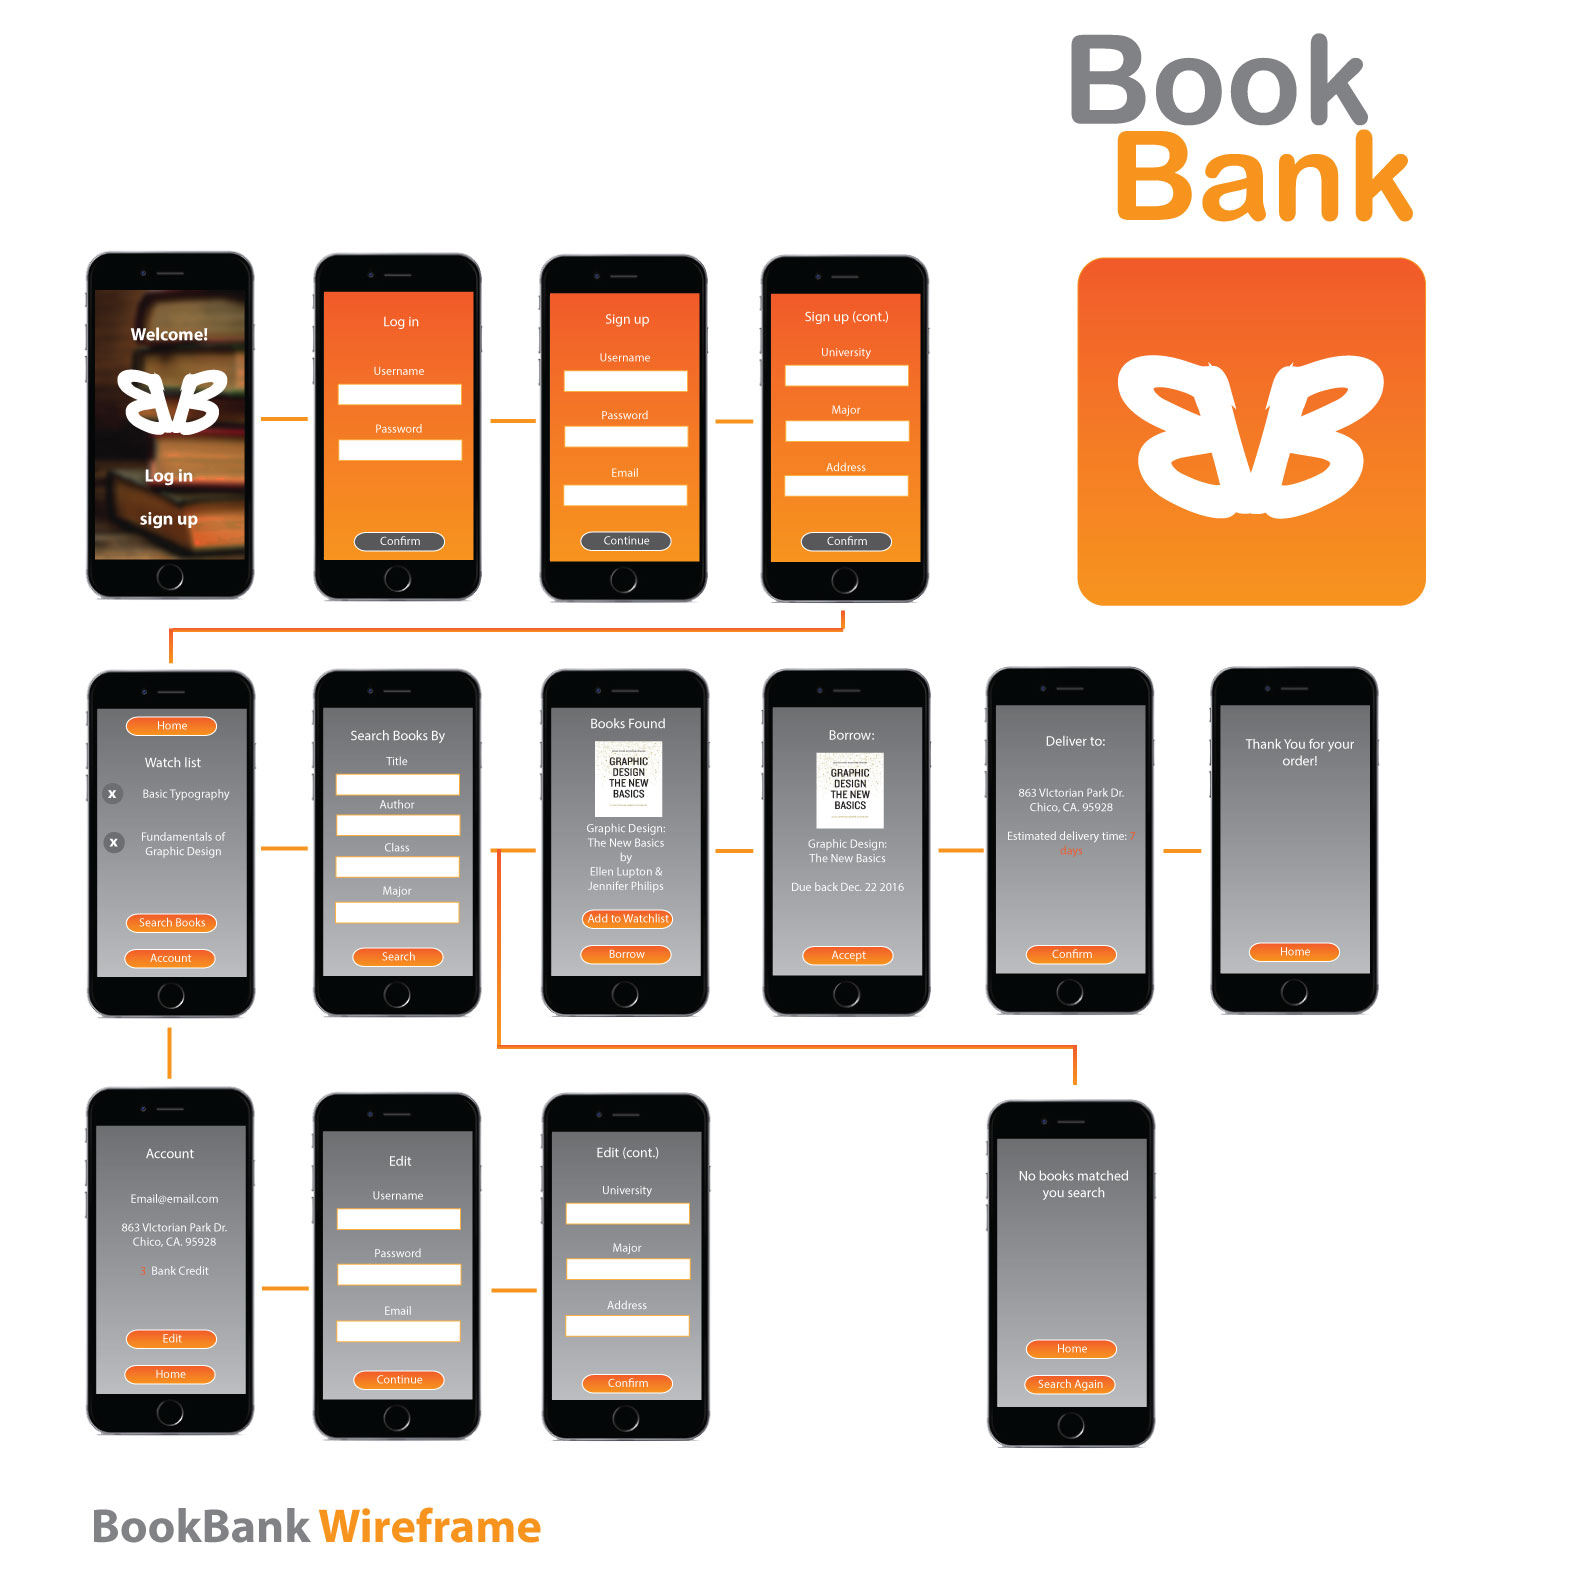
RadioStar
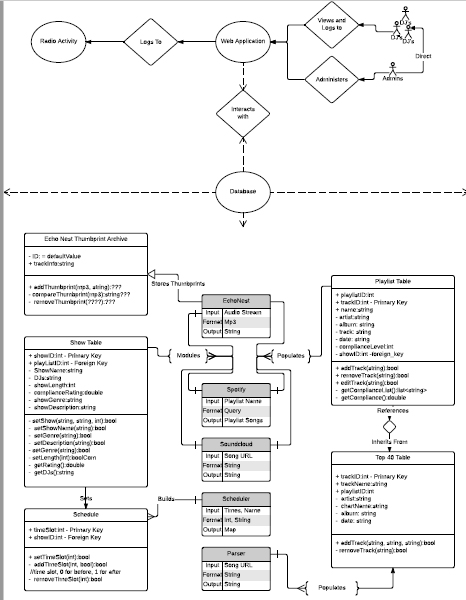
Create a fully functioning app for Chico State’s student run radio station KCSC. This App is to replace and modernize KCSC’s old radio
compliance system called“radioactivity.”
RadioSTAR will be used to keep track of set lists, set times, communication among radio dj’s, as well as track compliance with KCSC’s strict music polices.
Student Activity Tracker
an interactive activity tracker that tracks 18 college student's activities for 24 hours.
For this Project I used Adobe Brackets to code HTML, CSS, and JAVASCRIPT to create an interactive web experience for users to visualize quantities of activities that 18 students partook in a 24 hour period. The activities are broken up by color and follow and arced path and animate on a timeline at the time the web page is loaded. The longer the path the more popular the activity was among the students. The students are also represented by their own circles at the bottom of the window and are broken up by sex (either blue for male or pink for female). As the user mouses over activities on the left the other activity's arcs will "grey out" and individual arcs can be seen around the students initials.
Water Footprint Timeline
Create an interactive timeline representing my water footprint throughout a 24 hour span
For this project I created an animated timeline for users to interact with using HTML, CSS, and JAVASCRIPT. This timeline displays water consumption throughout a 24 hour period comparing average american water consumption, my water consumption, and my new projected water consumption. The bar graph directly compares all of these avenues of water usage for the viewer to clearly see. This was created in the hopes that one can better track water usage and find ways to lessen water consumption.
See Also...
In depth UI/UX Design comes from a deeper understanding of Graphic Design concepts